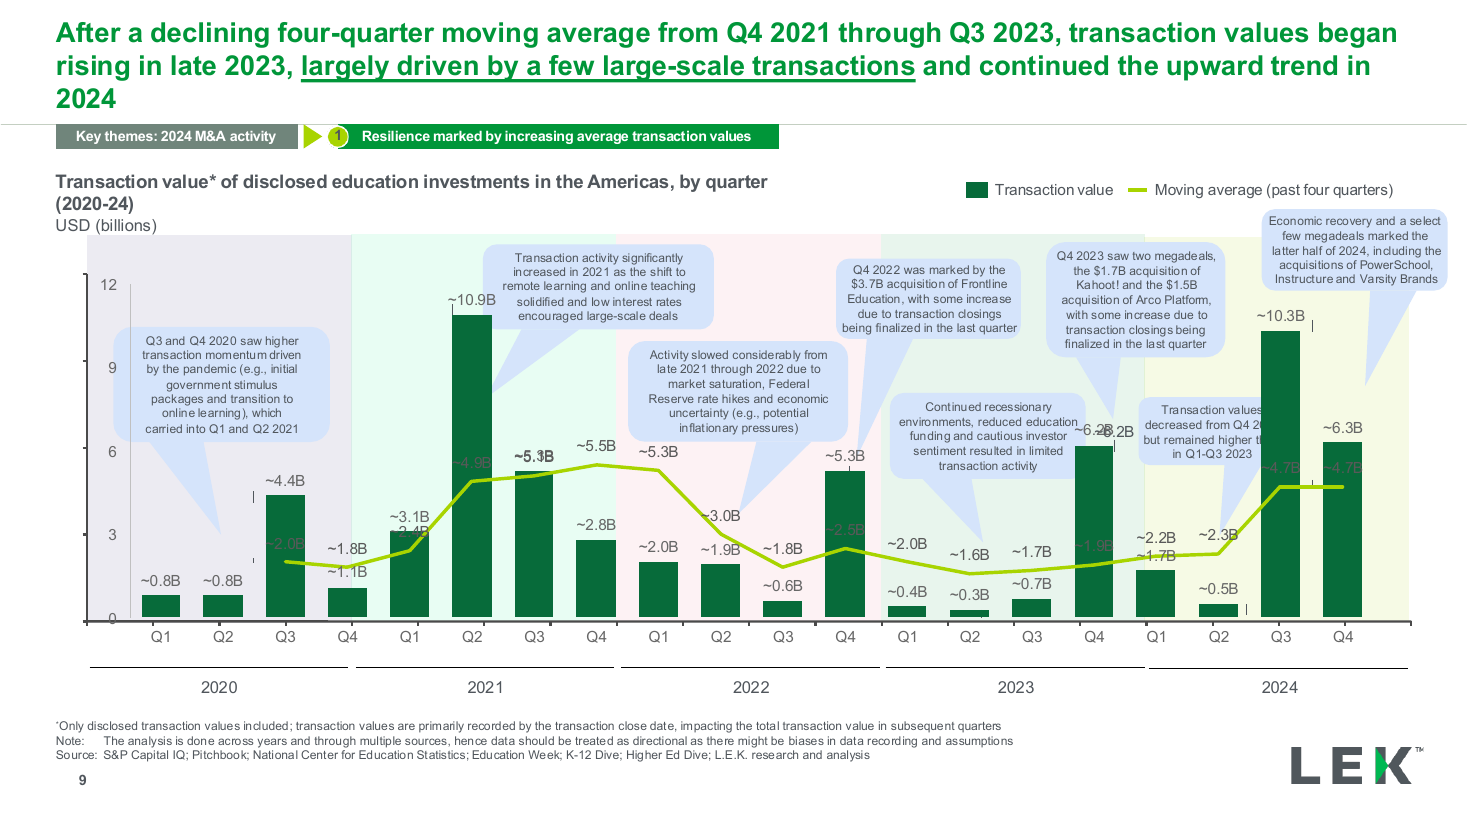
Quarterly value trend with moving average
A split slide with a full-height statement panel on the left and a grouped horizontal bar chart on the right comparing three audience segments across three survey years. Use it to show how one metric moved by segment and to flag the segment that stalled.
Source: Recreated as a native, fully editable PowerPoint slide from page 6 of AI at Work 2025, a publicly published BCG deck. Not affiliated with or endorsed by BCG.
More like this