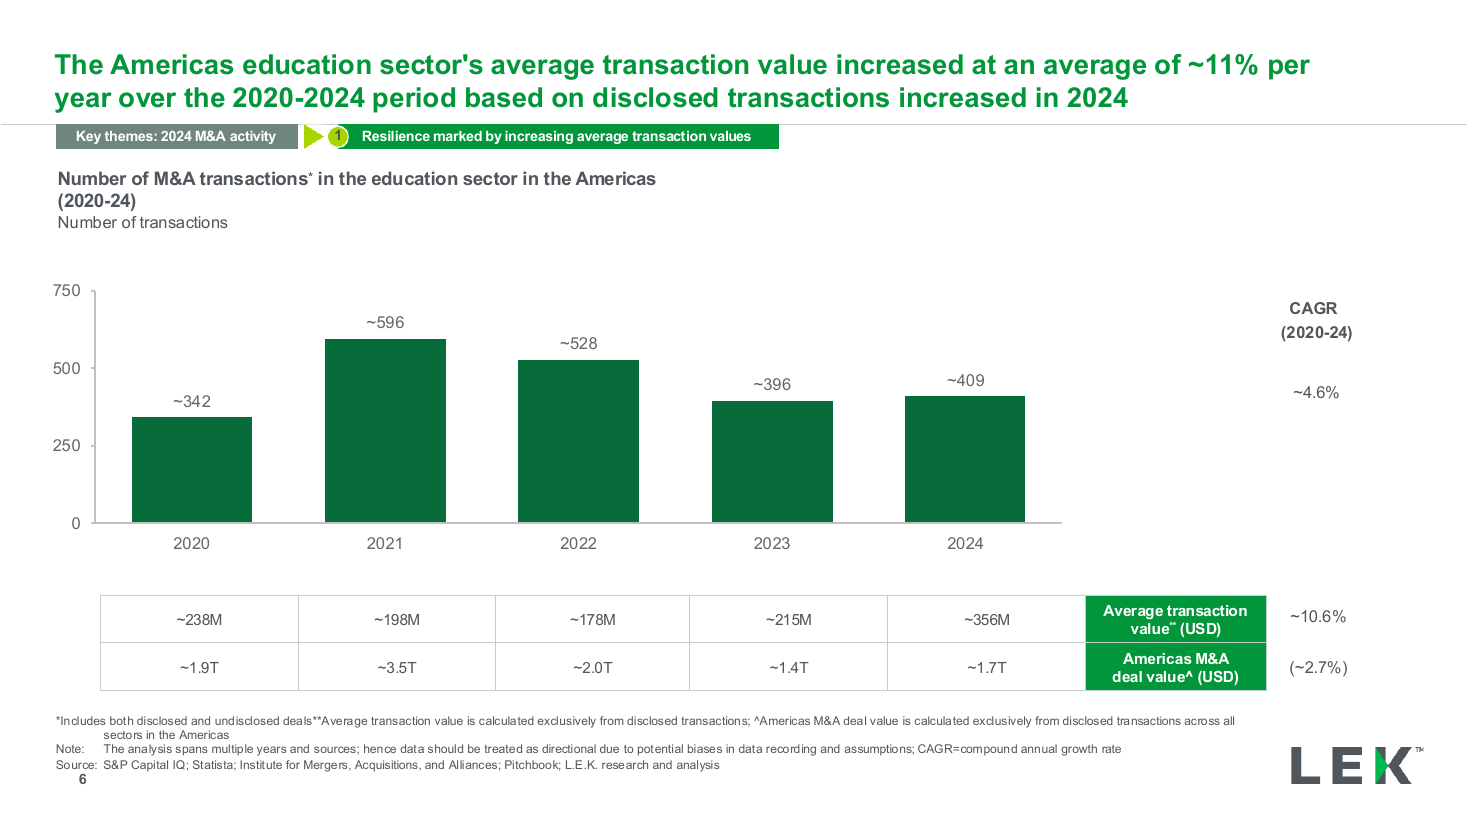
Deal volume by year column chart with CAGR
One wide column chart ranking thirteen barriers from highest to lowest share, with long wrapped labels beneath every column and a text callout floating over the plot. Use it when a single long ranked list is the whole point of the page.
Source: Recreated as a native, fully editable PowerPoint slide from page 11 of Stablecoins in Focus 2025, a publicly published EY-Parthenon deck. Not affiliated with or endorsed by EY-Parthenon.
More like this