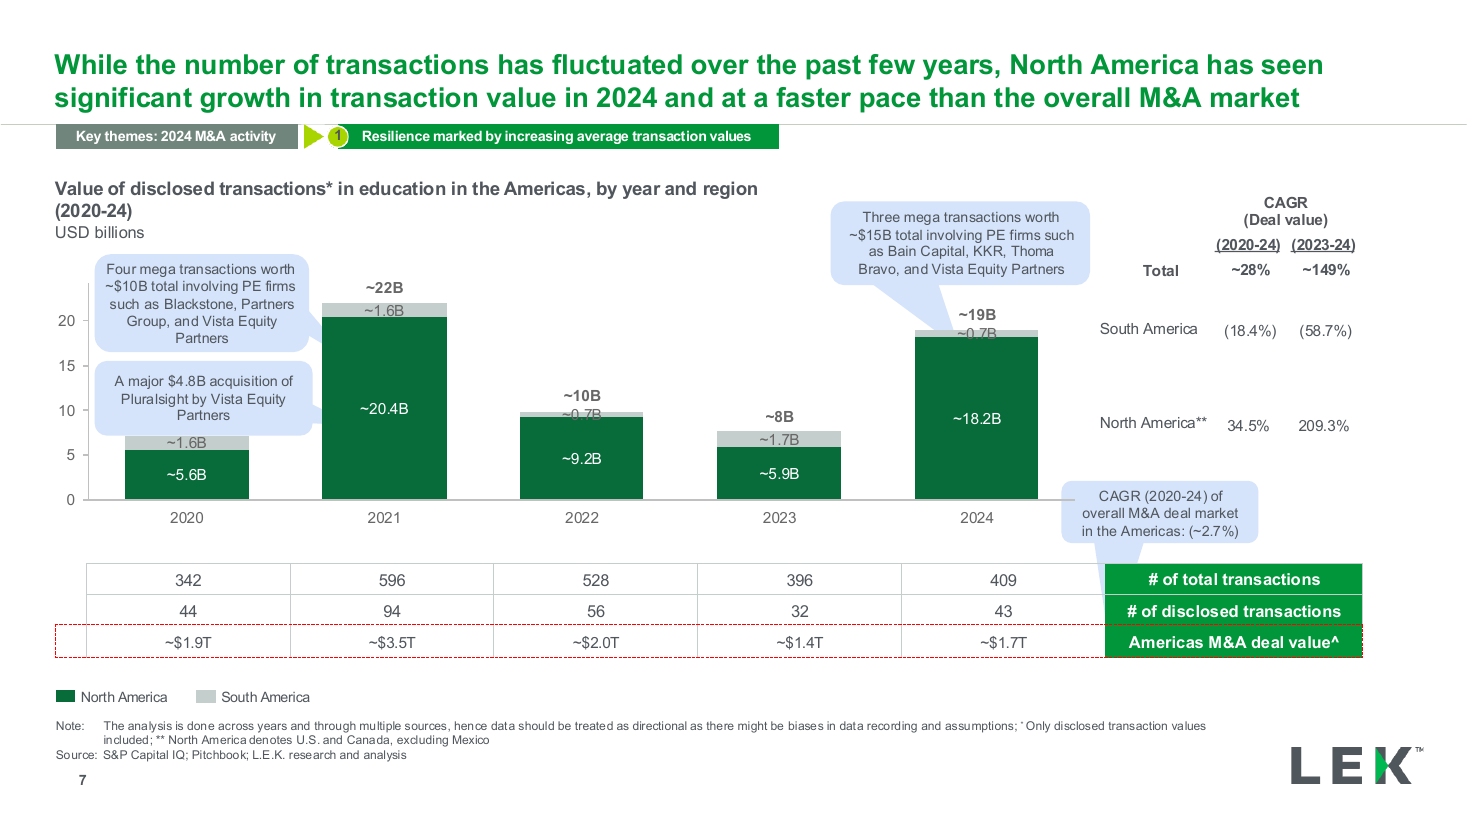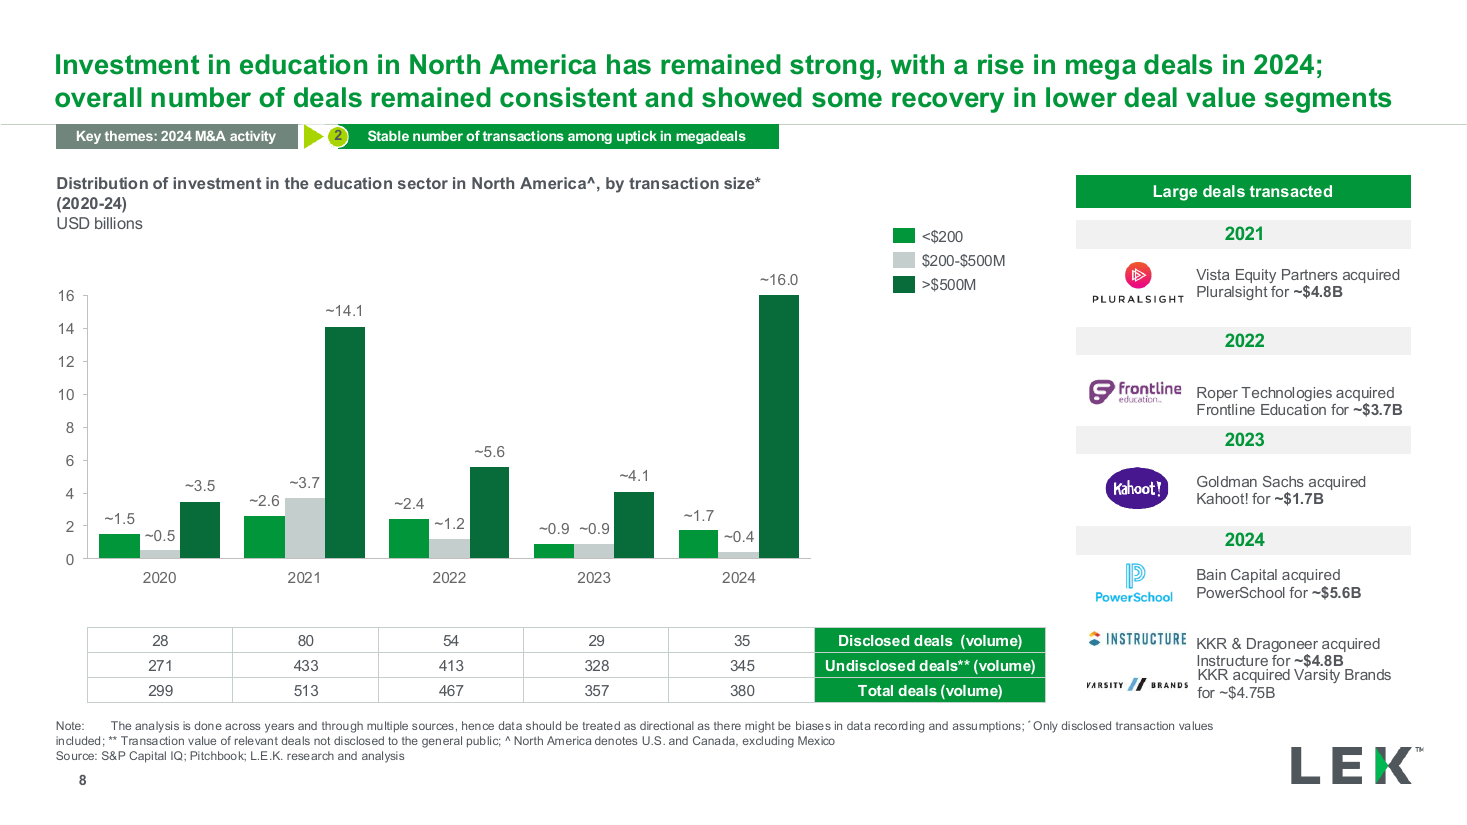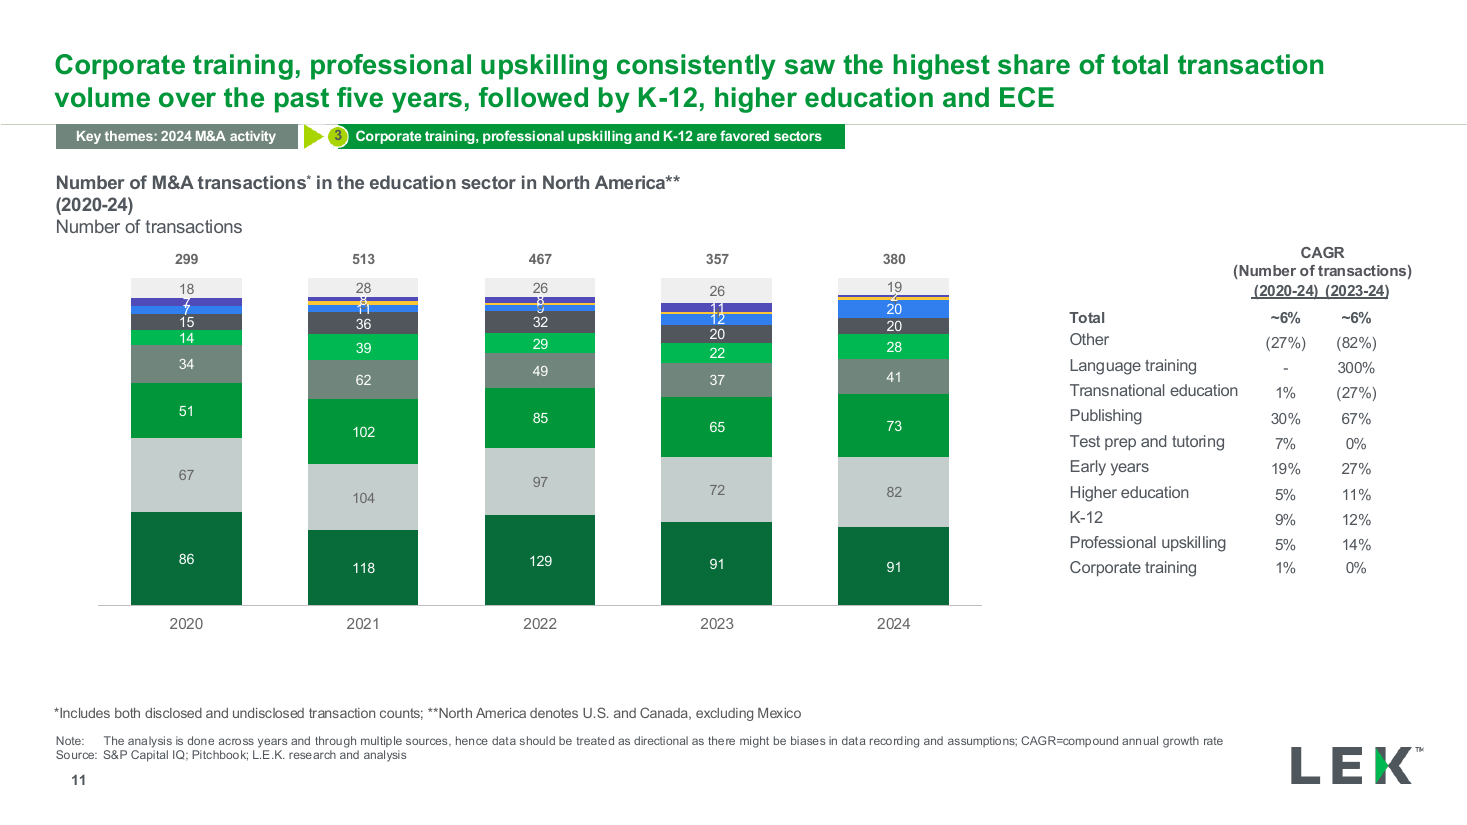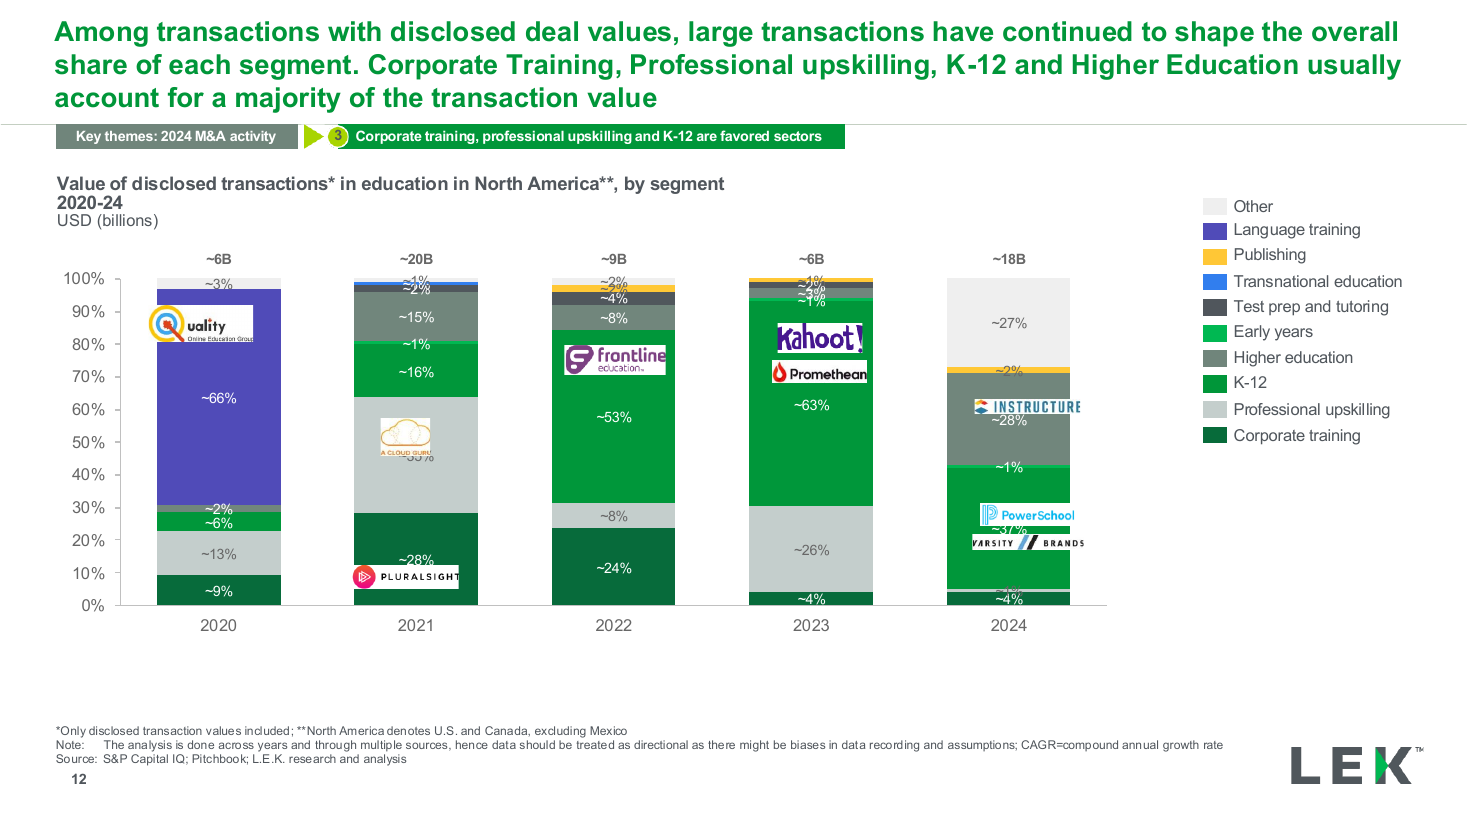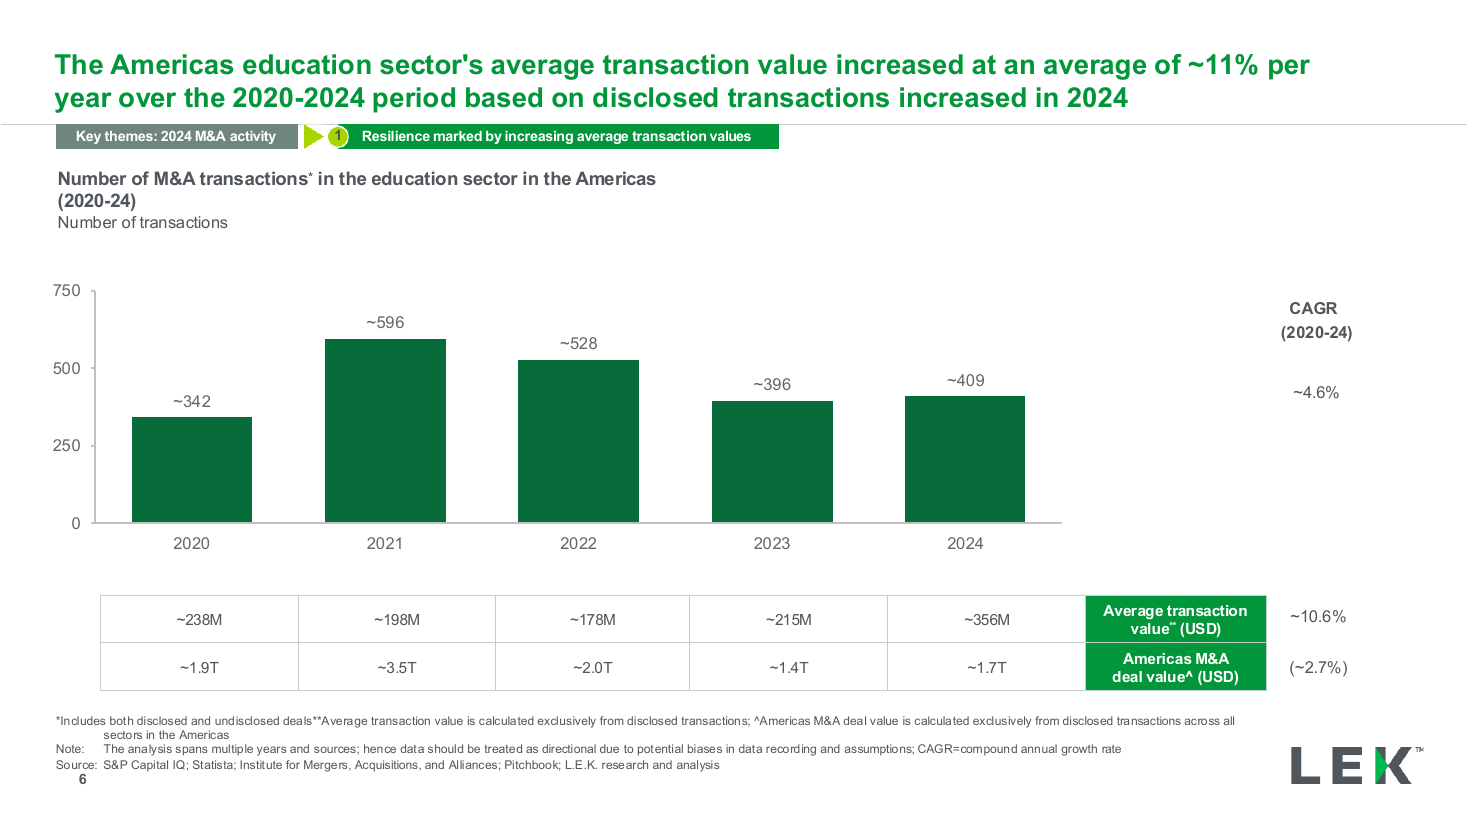
Deal volume by year column chart with CAGR
A single large horizontal bar chart ranking ten use cases from lowest to highest share, with two short commentary callouts placed in the white space beside the shorter bars. Use it when a ranked list needs annotation rather than a second exhibit.
Source: Recreated as a native, fully editable PowerPoint slide from page 13 of Stablecoins in Focus 2025, a publicly published EY-Parthenon deck. Not affiliated with or endorsed by EY-Parthenon.
More like this