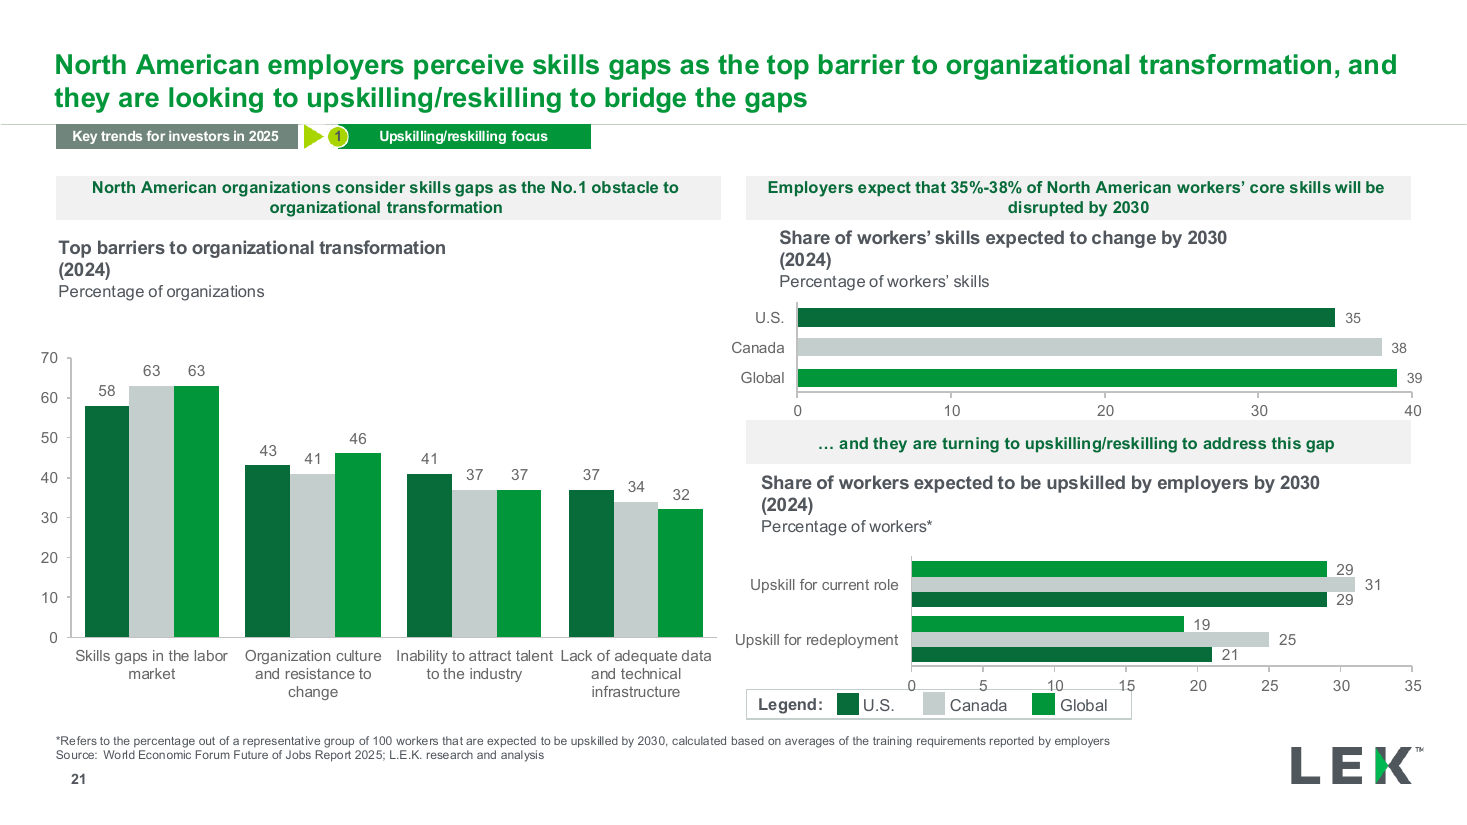
Skills gap survey three-chart panel
A two by two grid of donut charts profiling a survey sample by region, revenue band and sector, each ring labelled around the outside and captioned in the centre. Use it to show who answered a survey before presenting its results.
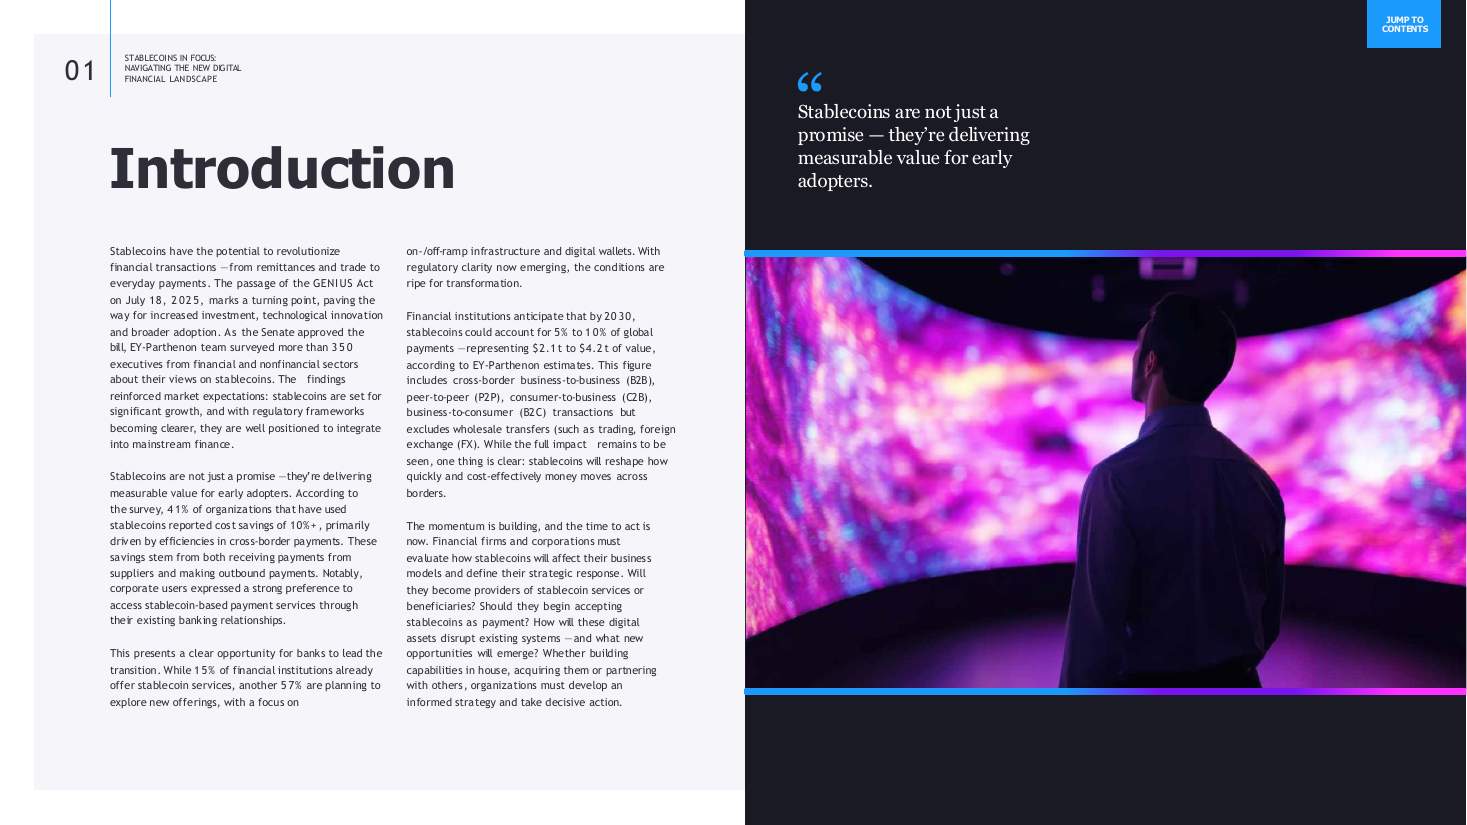
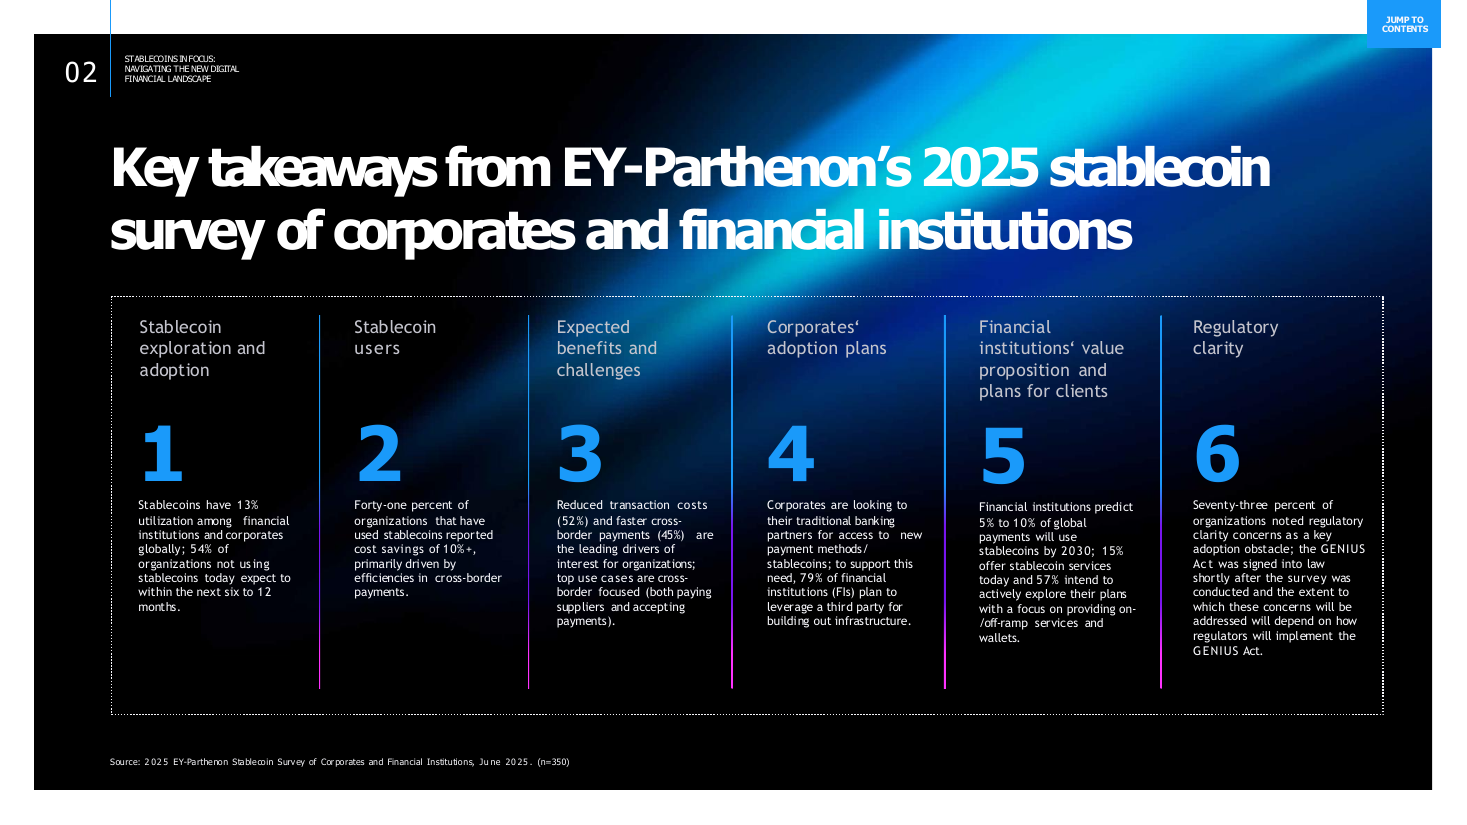
Source: Recreated as a native, fully editable PowerPoint slide from page 7 of Stablecoins in Focus 2025, a publicly published EY-Parthenon deck. Not affiliated with or endorsed by EY-Parthenon.
More like this