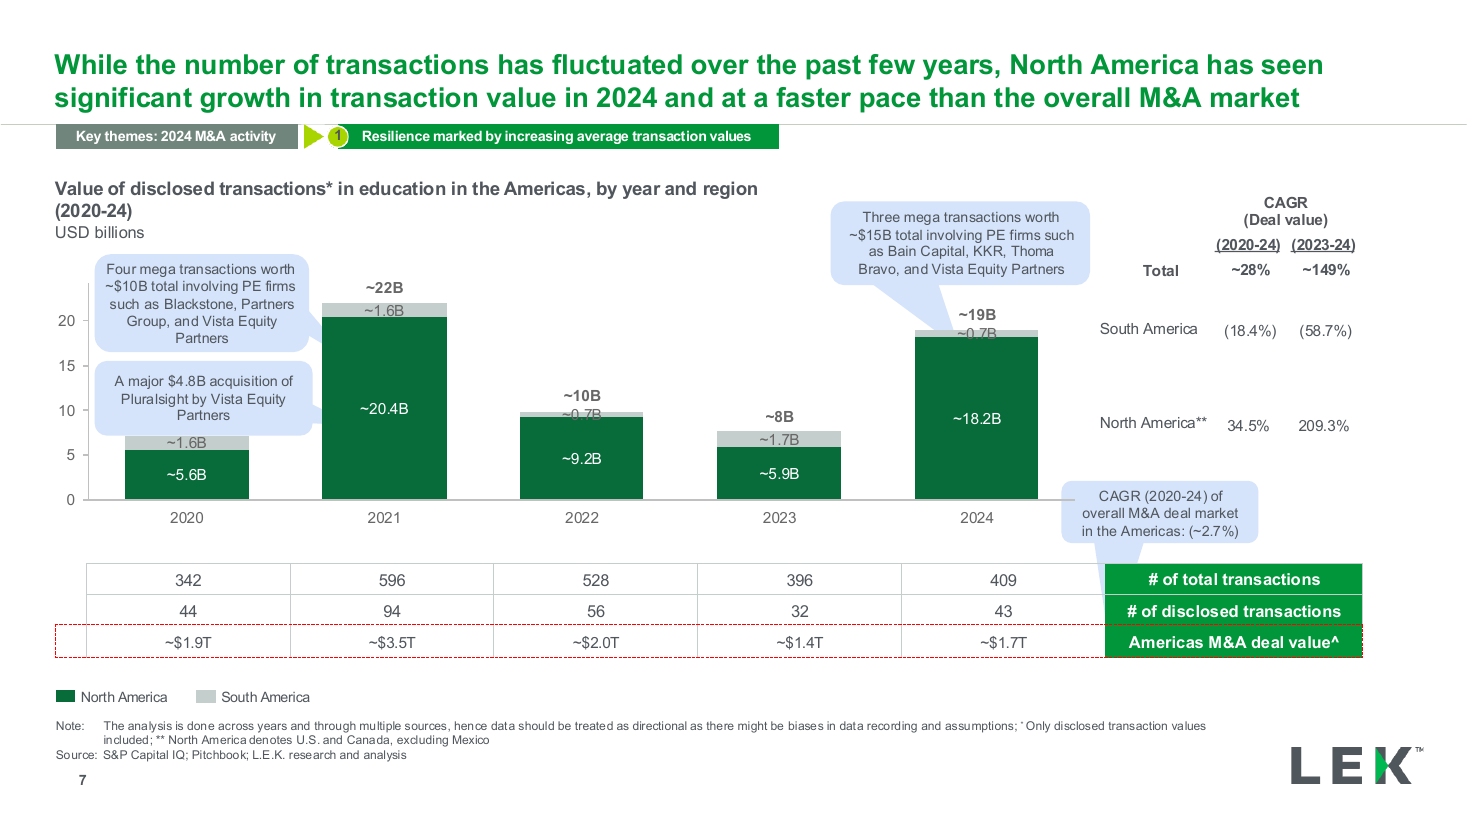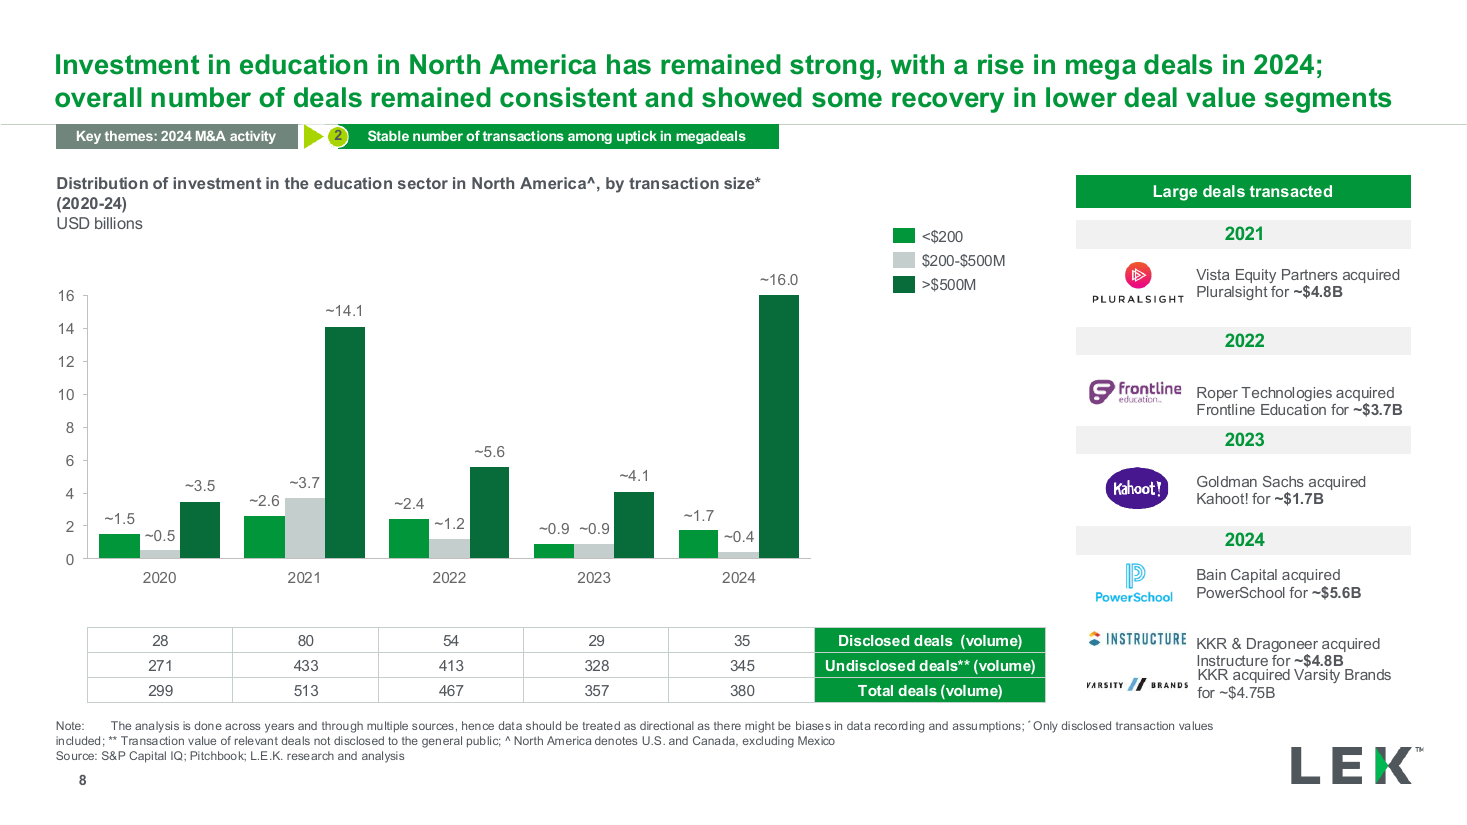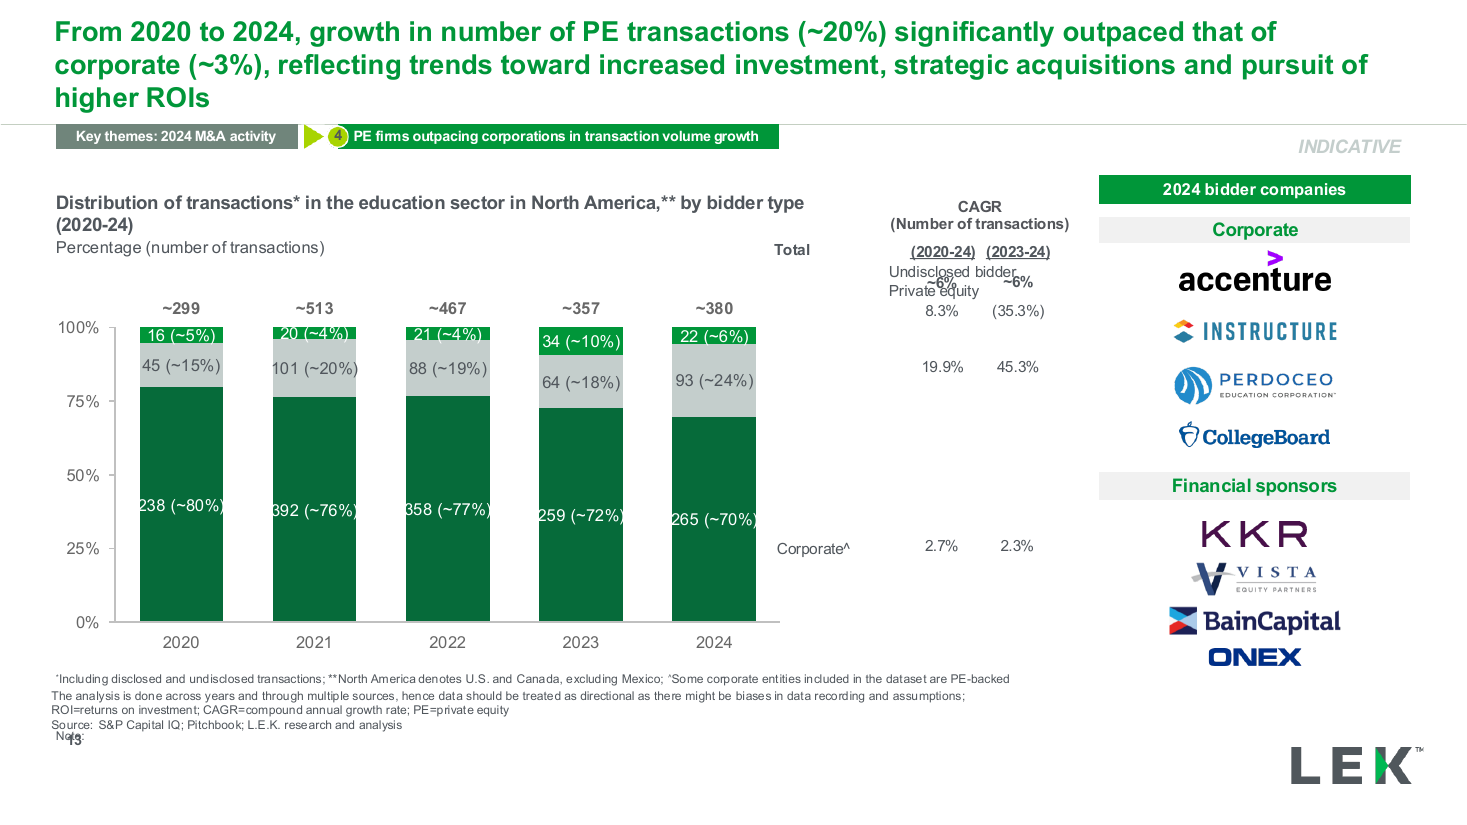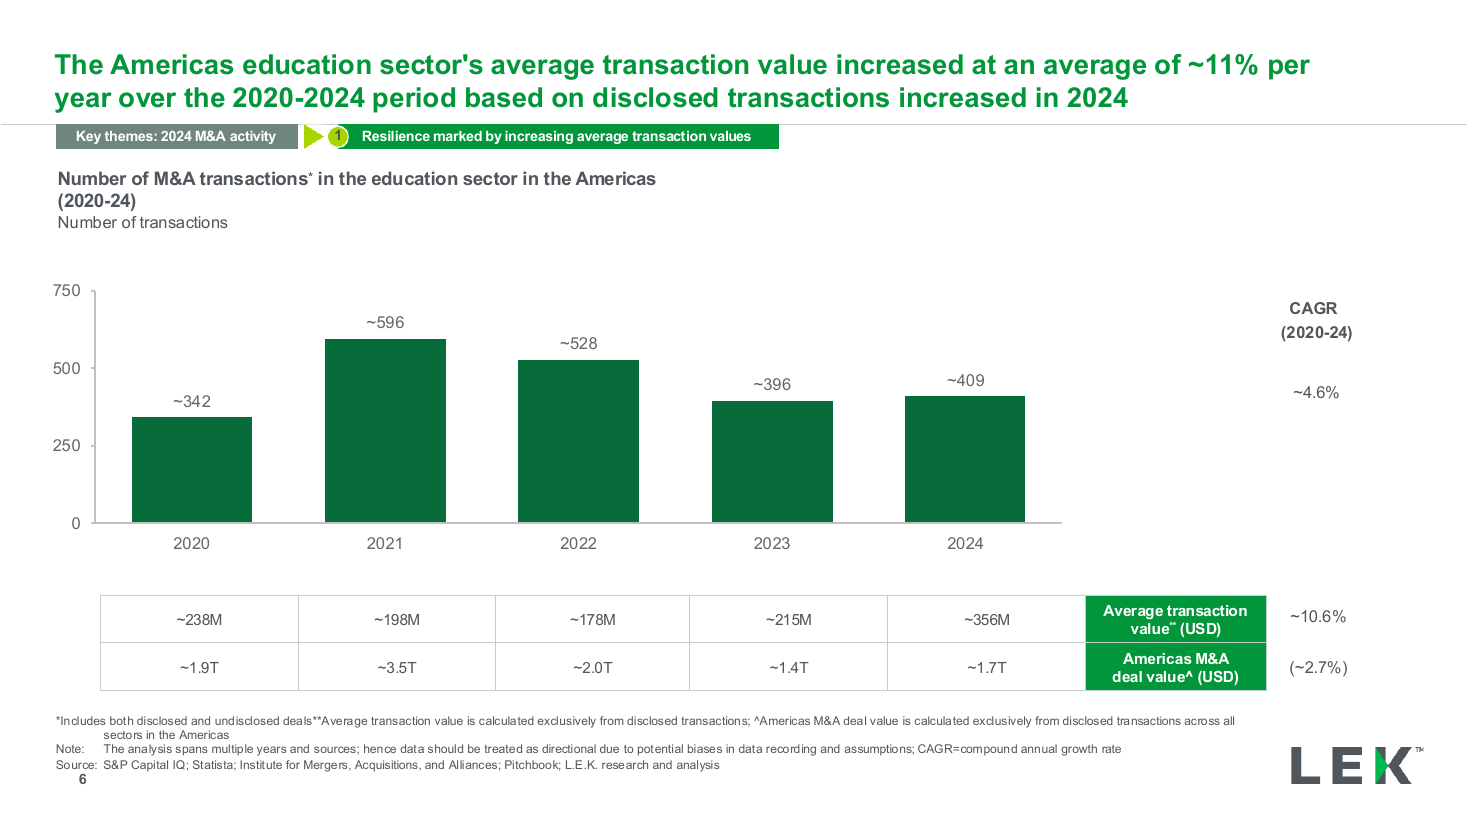
Deal volume by year column chart with CAGR
Every transaction in a screen ranked by premium as a descending bar chart, with a median reference line across the plot and a dense per-transaction table set directly beneath, column-aligned to the bars.
Source: Recreated as a native, fully editable PowerPoint slide from page 7 of Aspen Technology Project Alpha Pitch Book 2024, a publicly published Qatalyst Partners & Citi deck. Not affiliated with or endorsed by Qatalyst Partners & Citi.
More like this