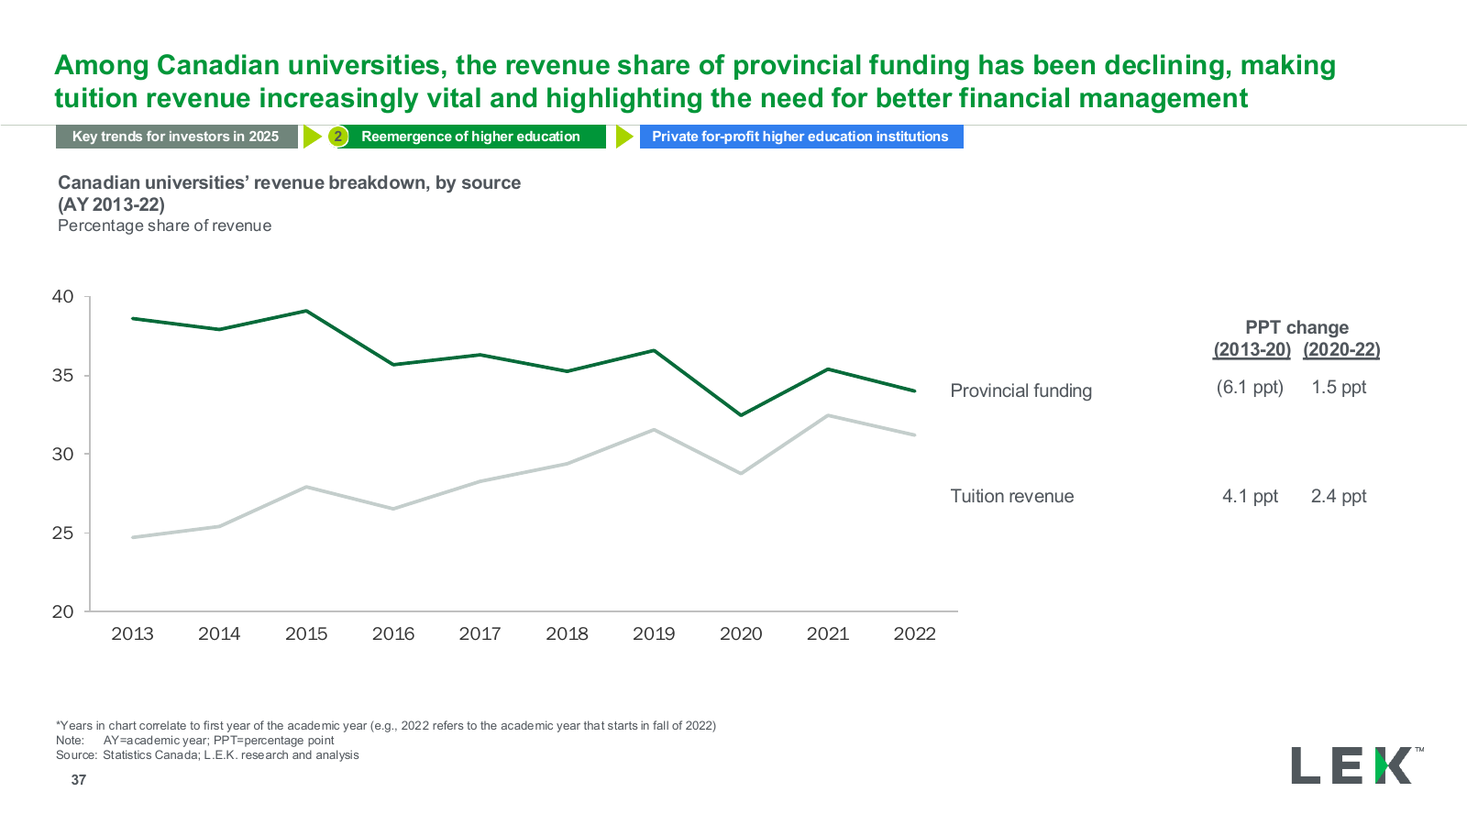
Canada university revenue source dual line chart
Two side-by-side multiple charts tracking a company against two named peers over a two-year window, with average tables inset and a note box explaining non-meaningful multiples.
Source: Recreated as a native, fully editable PowerPoint slide from page 12 of Squarespace Board Discussion Materials 2024, a publicly published Goldman Sachs deck. Not affiliated with or endorsed by Goldman Sachs.
More like this