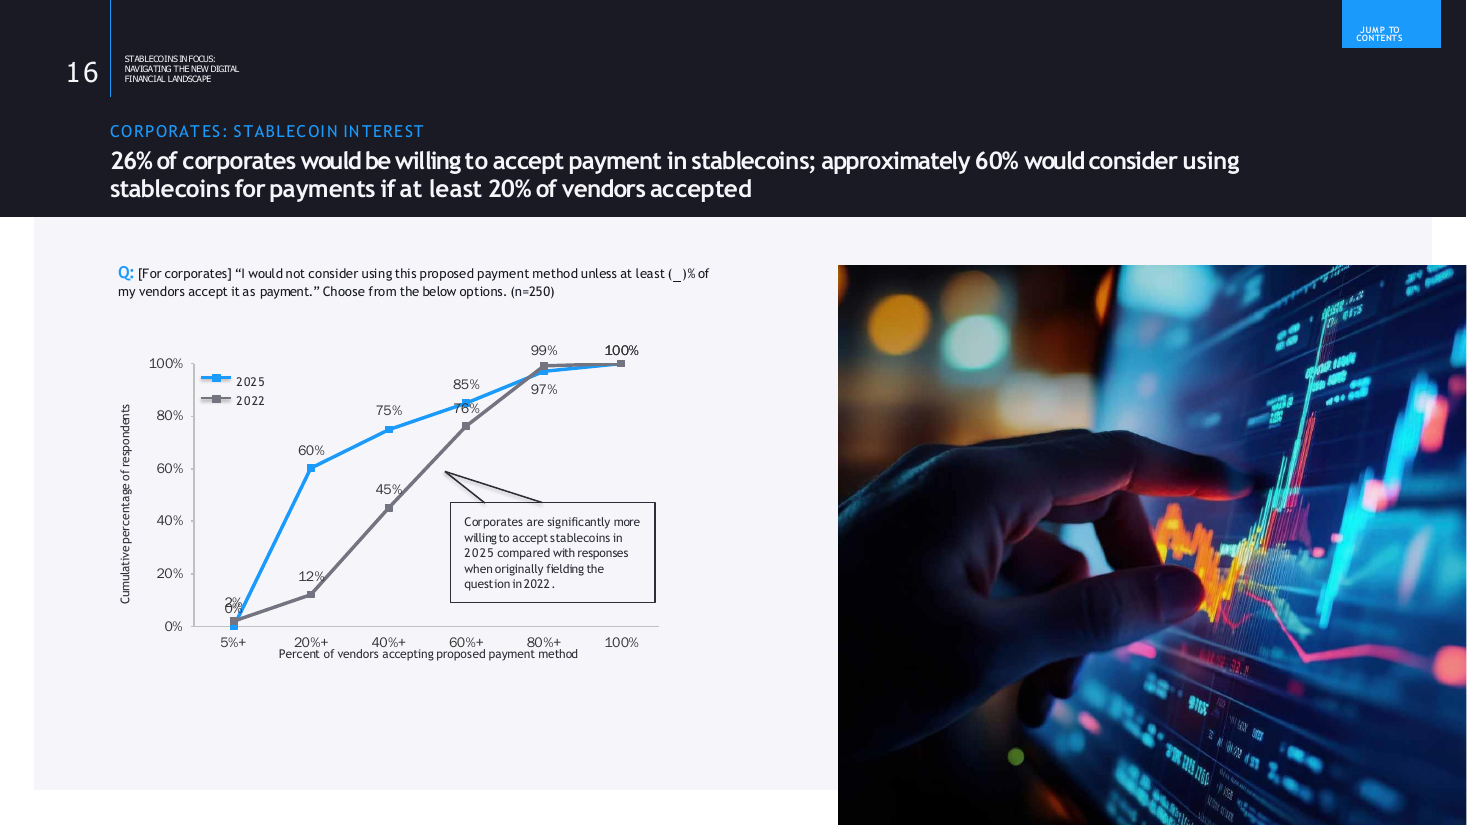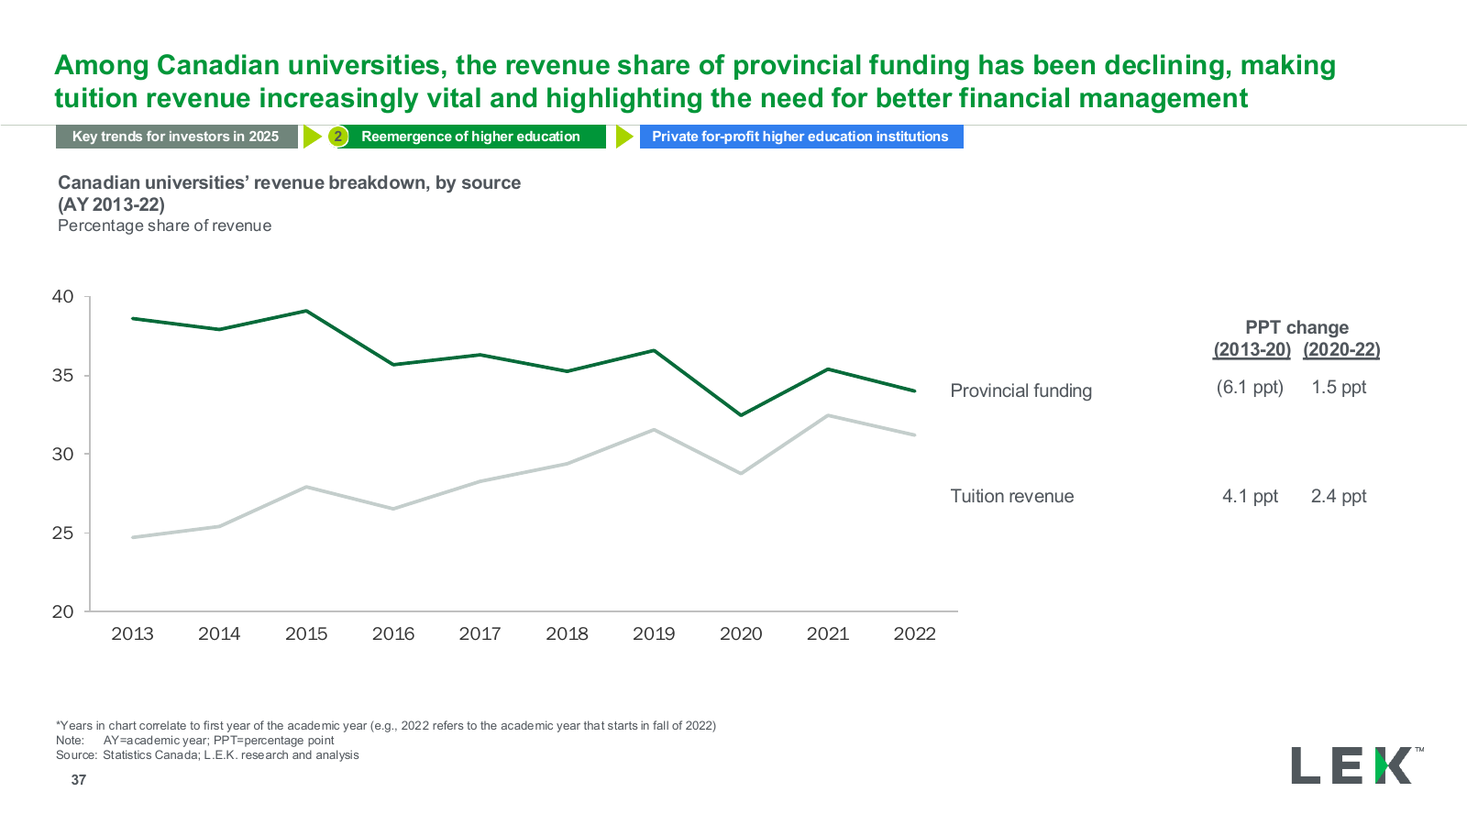
Canada university revenue source dual line chart
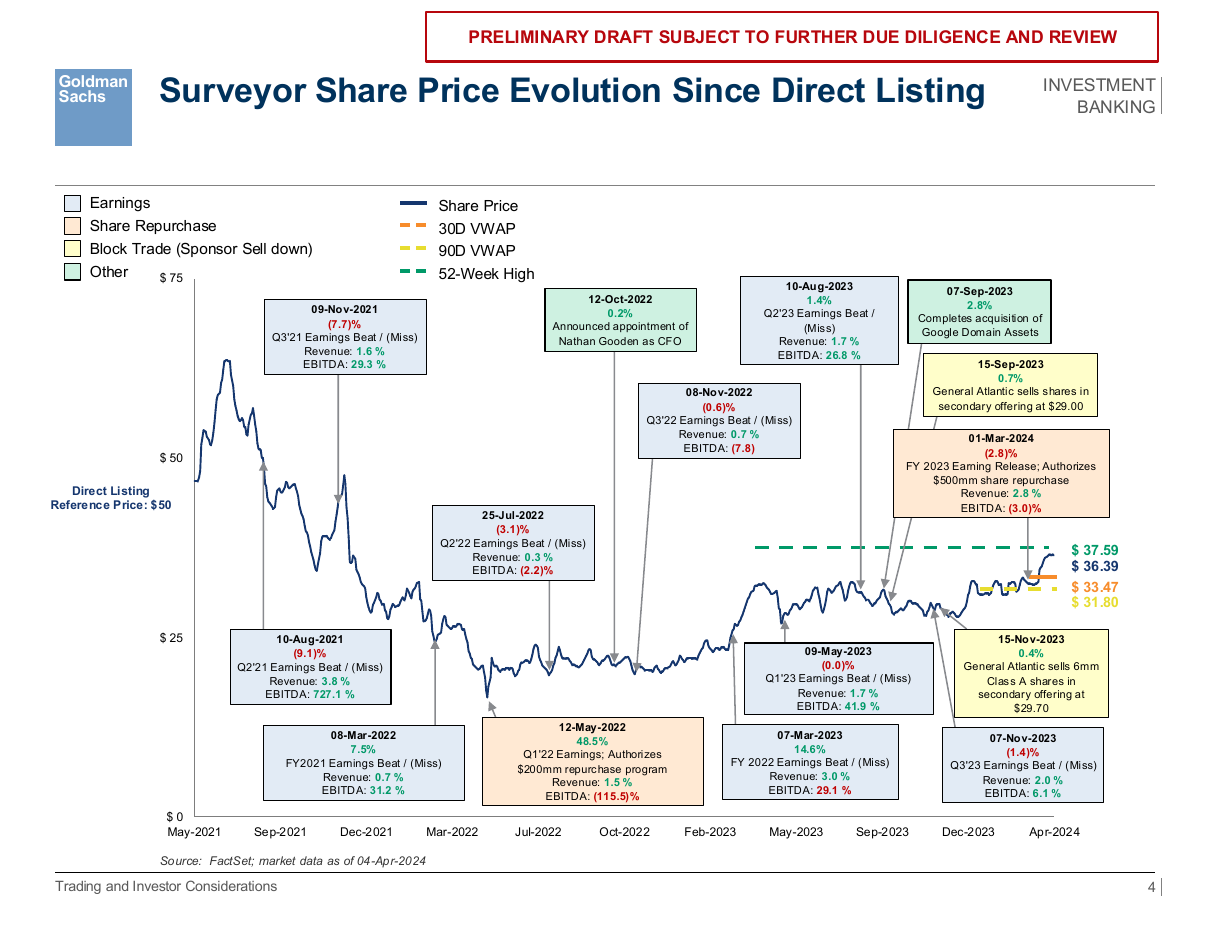
A share price history annotated with numbered event callouts, a statistics panel inside the plot and a key-developments block beneath.
Source: Recreated as a native, fully editable PowerPoint slide from page 53 of Avangrid Project Lean Pitch Book 2024, a publicly published Moelis & Company deck. Not affiliated with or endorsed by Moelis & Company.
More like this